s anybody successfully using the adapt-chartjs plug-in on the authoring tool? It installs fine and can be added as a component with no problems, but when previewing the course you get a eternal loading icon right after clicking a page from the main menu. I even used the example from the github page https://github.com/dancgray/adapt-chartjs and it still doesn't progress.
adapt-chartjs working in AT?
Re: adapt-chartjs working in AT?
Hi there Khari,
I was able to get adapt-chartjs installed and appearing for both the framework and using the authoring tool. Perhaps there is something in the way that you configured the two data/options areas of the chart int he authoring tool. In the authoring tool,, this is what I had done:
For the Data Sets field: I'm guessing this is where there is a snag for you, as there is some uncertainty on what exactly goes where. You want to be sure to copy (from the author's example) just the information within the "data" property. I tried the first example of theirs, the bar chart example. What I copied was the following. This excluded the "data" name, but included the starting/ending curly braces and the two internal "labels" and "datasets" objects.
"labels": ["January", "February", "March", "April", "May", "June", "July"],
        "datasets": [
            {
                "label": "My First dataset",
                "backgroundColor": "rgba(255,99,132,0.2)",
                "borderColor": "rgba(255,99,132,1)",
                "borderWidth": 1,
                "hoverBackgroundColor": "rgba(255,99,132,0.4)",
                "hoverBorderColor": "rgba(255,99,132,1)",
                "data": [65, 59, 80, 81, 56, 55, 40]
            },
            {
                "label": "My Second dataset",
                "backgroundColor": "rgba(255,99,132,0.2)",
                "borderColor": "rgba(255,99,132,1)",
                "borderWidth": 1,
                "hoverBackgroundColor": "rgba(255,99,132,0.4)",
                "hoverBorderColor": "rgba(255,99,132,1)",
                "data": [48, 42, 81, 63, 14, 9, 74]
            }
        ]
I pasted that, in the authoring tool, between the two existing curly braces {}. To repeat, this is just for the contents of the "data" object, nothing else should be included here, not even the name of the "data" object. This rules out the rest of the code, which includes generic component setup like the component ID and parent ID, etc.
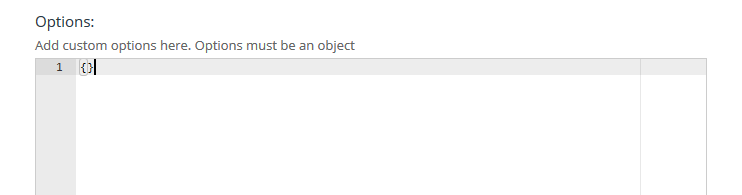
For the Options field: I didn't add anything here, leaving it blank {}.
If things don't work, provide a screen grab of your Data Sets field in the authoring too, or copy & paste what you added there.
Re: adapt-chartjs working in AT?
Thanks for the help, Scott. I remember first working through the same , but I still get the same problem. I copied and pasted what you posted, but still still get the loading problem.
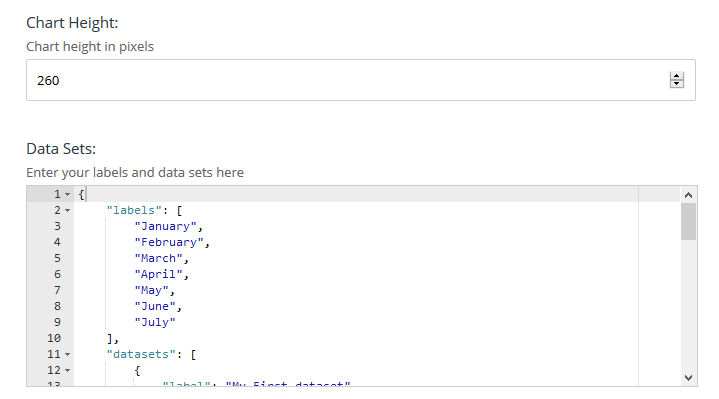
here's what I have posted in the data sets field:
{
"labels": [
"January",
"February",
"March",
"April",
"May",
"June",
"July"
],
"datasets": [
{
"label": "My First dataset",
"backgroundColor": "rgba(255,99,132,0.2)",
"borderColor": "rgba(255,99,132,1)",
"borderWidth": 1,
"hoverBackgroundColor": "rgba(255,99,132,0.4)",
"hoverBorderColor": "rgba(255,99,132,1)",
"data": [
65,
59,
80,
81,
56,
55,
40
]
},
{
"label": "My Second dataset",
"backgroundColor": "rgba(255,99,132,0.2)",
"borderColor": "rgba(255,99,132,1)",
"borderWidth": 1,
"hoverBackgroundColor": "rgba(255,99,132,0.4)",
"hoverBorderColor": "rgba(255,99,132,1)",
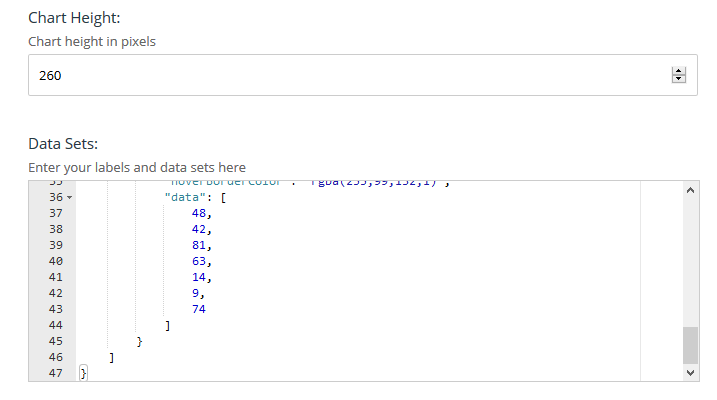
"data": [
48,
42,
81,
63,
14,
9,
74
]
}
]
}
here are screenshots:
bottom of same textarea:
I also left Options blank
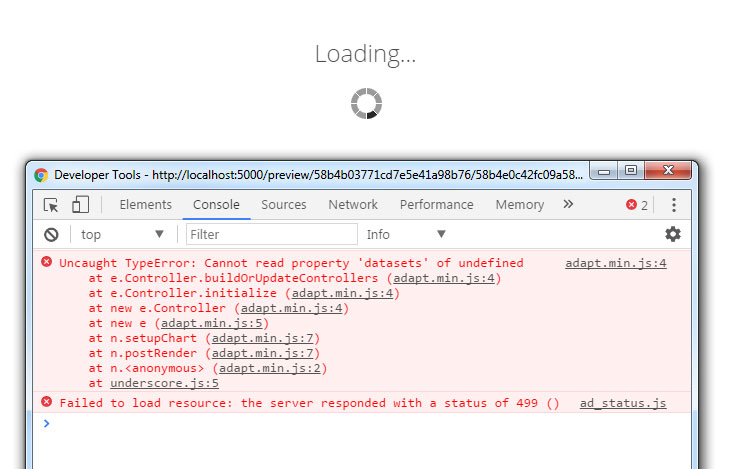
This is what I get when I preview and it just never loads

Really crazy. when I remove the chart - the page loads with no problems. This is using the theme-odi, but I got the same when I tried with contrib-vanilla. I also tried a course with only the chart , but the page just will not load.
Re: adapt-chartjs working in AT?
Things look okay, from the screen grabs you show. Here are some other thoughts:
The authoring tool does do a syntax check on the entered JSON, so it's probably not a JSON validation issue.
I was also wondering if the dropdown selection for chart type might be a mismath for the JSON data, but I confirmed that I could choose any of the chart types with this same data and have the chart appear.
The only way I could reproduce was by removing the data and leaving it as {}
I think your next step could involve using your browser's debug tools when you see the loading screen hang, and looking at the errors/exceptions in the console. With my "empty dataset" test, all this pointed me to was that the 'datasets' property was undefined...but it was accurate. Maybe you'll find a helpful message or a breadcrumb there.
I don't have any other suggestions that come to mind...
Re: adapt-chartjs working in AT?
Thanks for the help, Scott. I compared the console output of a preview with the chart and without the chart and the only differences were tons of "HTTP/1.1 304 Not Modified" and one TypeError: a is not a constructor[Learn More] adapt.min.js:78:27598
In short no groundbreaking info. I tried on another AT install and it worked with no problems, so at least I have it working somewhere.
Re: adapt-chartjs working in AT?
Khari, that's an interesting find with the other AT install. Earlier I had wondered about removing the component and reinstalling it, but there's no remove/uninstall feature in the AT. Separately, I wonder if you were to create a new course and add the component there, what would happen; just a scenario to retry/isolate things.
Have you installed any other 3rd party plugins? If not, also try finding some of the other components out there and seeing if they work. I honestly can't say, but if other components you install don't work, it might point to some AT installation problem.
Re: adapt-chartjs working in AT?
Scott, yeah, I was also hoping I could do a remove/re-install, but quickly remembered you can't delete plug-ins from the AT. I actually have only been using this AT instance for serious work and had been following a strict vetting process before installing plugins, but somehow I messed up with this one. On the AT instance I also have a couple of other 3rd part plugins like stacklist, dragndrop, hotgrid, expose, and they all seem to work fine. I actually did try a new course with just the chartjs added, but still got the same. This was how I truly confirmed it had to only be the component causing the issue. I think you might be right, though. It could be an AT installation problem
Re: adapt-chartjs working in AT?
Khari, if you had thoughts about trying to remove the component and re-install it (just in the event that there's something goofy that is going on, perhaps from its install or who knows why), there is some information about how to pursue that here: https://github.com/adaptlearning/adapt_authoring/wiki/FAQ#hdap
Re: adapt-chartjs working in AT?
Hi Khari,
Just to make the story complete, you did select the chart type being Line, correct? Because it does make a difference in data values. I've been playing with it myself and choosing the wrong set for the chart could give strange output.
More details on the underlaying module; http://www.chartjs.org/docs/
Good luck
Re: adapt-chartjs working in AT?
thanks for the help, John. I actually did try setting the Line type and tried all the others as well. it always lets me save and go back to the page view, but when I preview, then pass the menu to load the page with the chart on it, that's when it hangs. It's so odd, but the documentation you shared is good and quite extensive. I'm new to it , so that will definitely come in handy! Have you created many types of charts yet?
Re: adapt-chartjs working in AT?
Unfortunately I see the same behaviour when using the component in the Authoring Tool, although it works fine in the framework. The error logged in the console means nothing to me:
Uncaught TypeError: s is not a constructor at O.n.addChildren (adapt.min.js:62) at O.n.postRender (adapt.min.js:62) at O.n.<anonymous> (adapt.min.js:62) at adapt.min.js:60
Re: adapt-chartjs working in AT?
Further exploration suggests it's an AT or Framework compatibility issue since it works fine in v0.3.0/v2.1.2 respectively, but not in v0.2.2/v2.0.7. I've added it as an issue on the component's github page.