Picture of Helen Bailey
Hotgraphic
by Helen Bailey - Wednesday, 22 April 2015, 9:15 AM
 

Hi me again!

Authoring tool - have added a hotgraphic with one pin. PNG image of a screesnhot.

When I preview the page I see my article and block and then a tiny square about 5 by 5 pixels, centred just below the block. If I click on this I see my pin, but it stays where it is irrespective of the coordinates I put in for the pin.

Also doesn't work if I change the hotrgraphic image.

Any ideas?

Thanks!


Picture of Helen Bailey
Re: Hotgraphic
by Helen Bailey - Wednesday, 22 April 2015, 4:10 PM
 

Oh I figured it out - I had set "Use graphics as pins" to true.

D'oh!

Picture of sander van zijl
Re: Hotgraphic
by sander van zijl - Friday, 10 July 2015, 9:37 AM
 

Is there a manual that explains how to use this feature.

It is clear how to use this component when showing the main graphic with the pins.

but how does this component work when I set "use graphics as pins" to true in the authoring tool.

Picture of Matt Leathes
Re: Hotgraphic
by Matt Leathes - Friday, 10 July 2015, 1:21 PM
 

According to the README for that component,

"When this is set to true, the item graphics can be used as 'pins'. When this is set to 'false' (per default), a main poster image is displayed, with pins overlayed to trigger the hot spots."

Does this help at all? I'm guessing you also need to set a _graphic property for each of the _items

Picture of sander van zijl
Re: Hotgraphic
by sander van zijl - Monday, 13 July 2015, 7:50 AM
 

I have read the readme :-)

When you set the property to true, all it seems to do is to show nothing. So what I would like to know is what exactly do I have to do to get the item images to show up. I have set all the properties in the "add item"- popup.

I am using the standard version of the authoring tool, so let's assume I have no access to any css or other files. But if it is impossible to use this functionality from the authoring tool, then I would still like to have some instructions on how to do this. Which files do I need to change, what needs to be changed and why. Maybe someone has an example of a working setup?

This could also be read as an appeal to the developers to only publish something if it is well documented how it should be used.


Mark
Re: Hotgraphic
by Mark Lynch - Monday, 13 July 2015, 3:50 PM
 

Hopefully this will help

A hot graphic component enables a user to click on hot spots over an image and display a detailed popup that includes an image with text. This component will change to a narrative on mobile devices, this means the actions may not match any instructional text used so it includes a Mobile Body field where you can add specific instructions for mobile users on how to click through the narrative.


Pin position – Top and Left are based on a percentage of the image so Top 0 Left 0 will position the pin to the top left hand corner, Top 50 and Left 50 will position the pin in the centre of your image and Top 100 Left 100 will position the pin in the bottom right hand corner.


To add new hot graphic pins click on Add.

Under the Main properties:

  • Use graphics as pins: This should be set to ‘false.’ If set to 'true', the main graphic will be hidden and pins will be displayed as images which can be positioned using classes. So this would be used where you'd want to setup a grid type clickable system (like windows metro)
  • Cycle through item pagination: If set to 'true', the items in the pop up will be allowed to cycle through continuously
  • Hide pagination: If set to 'true', the previous and next links will not be shown on the popup toolbar
  • Mobile Body: This is the text that will appear when the component is viewed on mobile
  • Alt: This is the text for screen readers
  • Src: This is the main image that viewers will see and the pins will be displayed on.
  • Instruction: This is the instruction text for the Hot Graphic


Under the items bar:

  • Pin Position – Top: The vertical co-ordinate of the hotspot
  • Pin Position – Left: The horizontal co-ordinate of the hotspot
  • Title: This is the title of the image
  • Alt: This is the text for screen readers
  • Src: This is the image that appears on the pop up when a user clicks on hotspot
  • Strapline: The text that appears above the image on mobile
  • Body: The main text that appears when a user clicks on hotspot
  • Title: Title of the text that appears when a user clicks on hotspot

Picture of Brian Quinn
Re: Hotgraphic
by Brian Quinn - Monday, 13 July 2015, 4:17 PM
 

I've attached a screenshot which illustrates how the useGraphicsAsPins property can be used.

Note that you still have to set the left and top properties to set the initial position of the item, but by using classes you can layout the shape of the clickable area.  As Mark has mentioned, right now you're limited to a 4x2 grid.


Picture of sander van zijl
Re: Hotgraphic
by sander van zijl - Tuesday, 14 July 2015, 2:02 PM
 

first of all: thank you both for your extensive replies.

unfortunately they are still very unclear. that has probably more to do with how understand it than with your explanation. so i will try to tell you where i still do not understand.

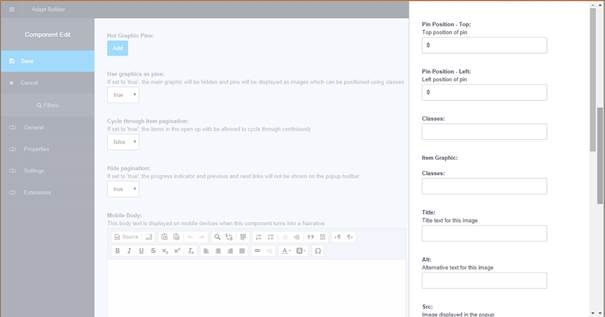
first here is what i understand: in stead of using a graphic, you can setup a grid that can be filled with the images set in the "hot graphics pins". when i click on one of these images, there will be a popup.

to setup the grid I would have to enter something in classes. so far so good?

my questions are mainly about what to enter in which classes-box:

1. which classes-box should I use. the classes-box on the main hot graphic, or the classes-box on the" Hot graphics pins". if it is the second: should I use the first or the second box.

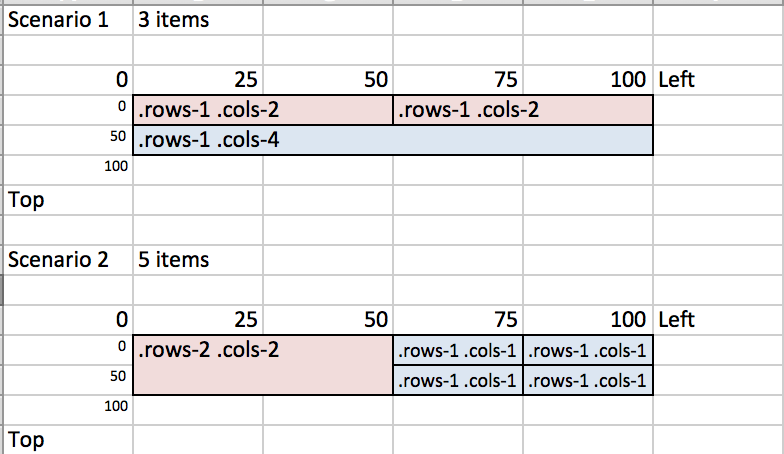
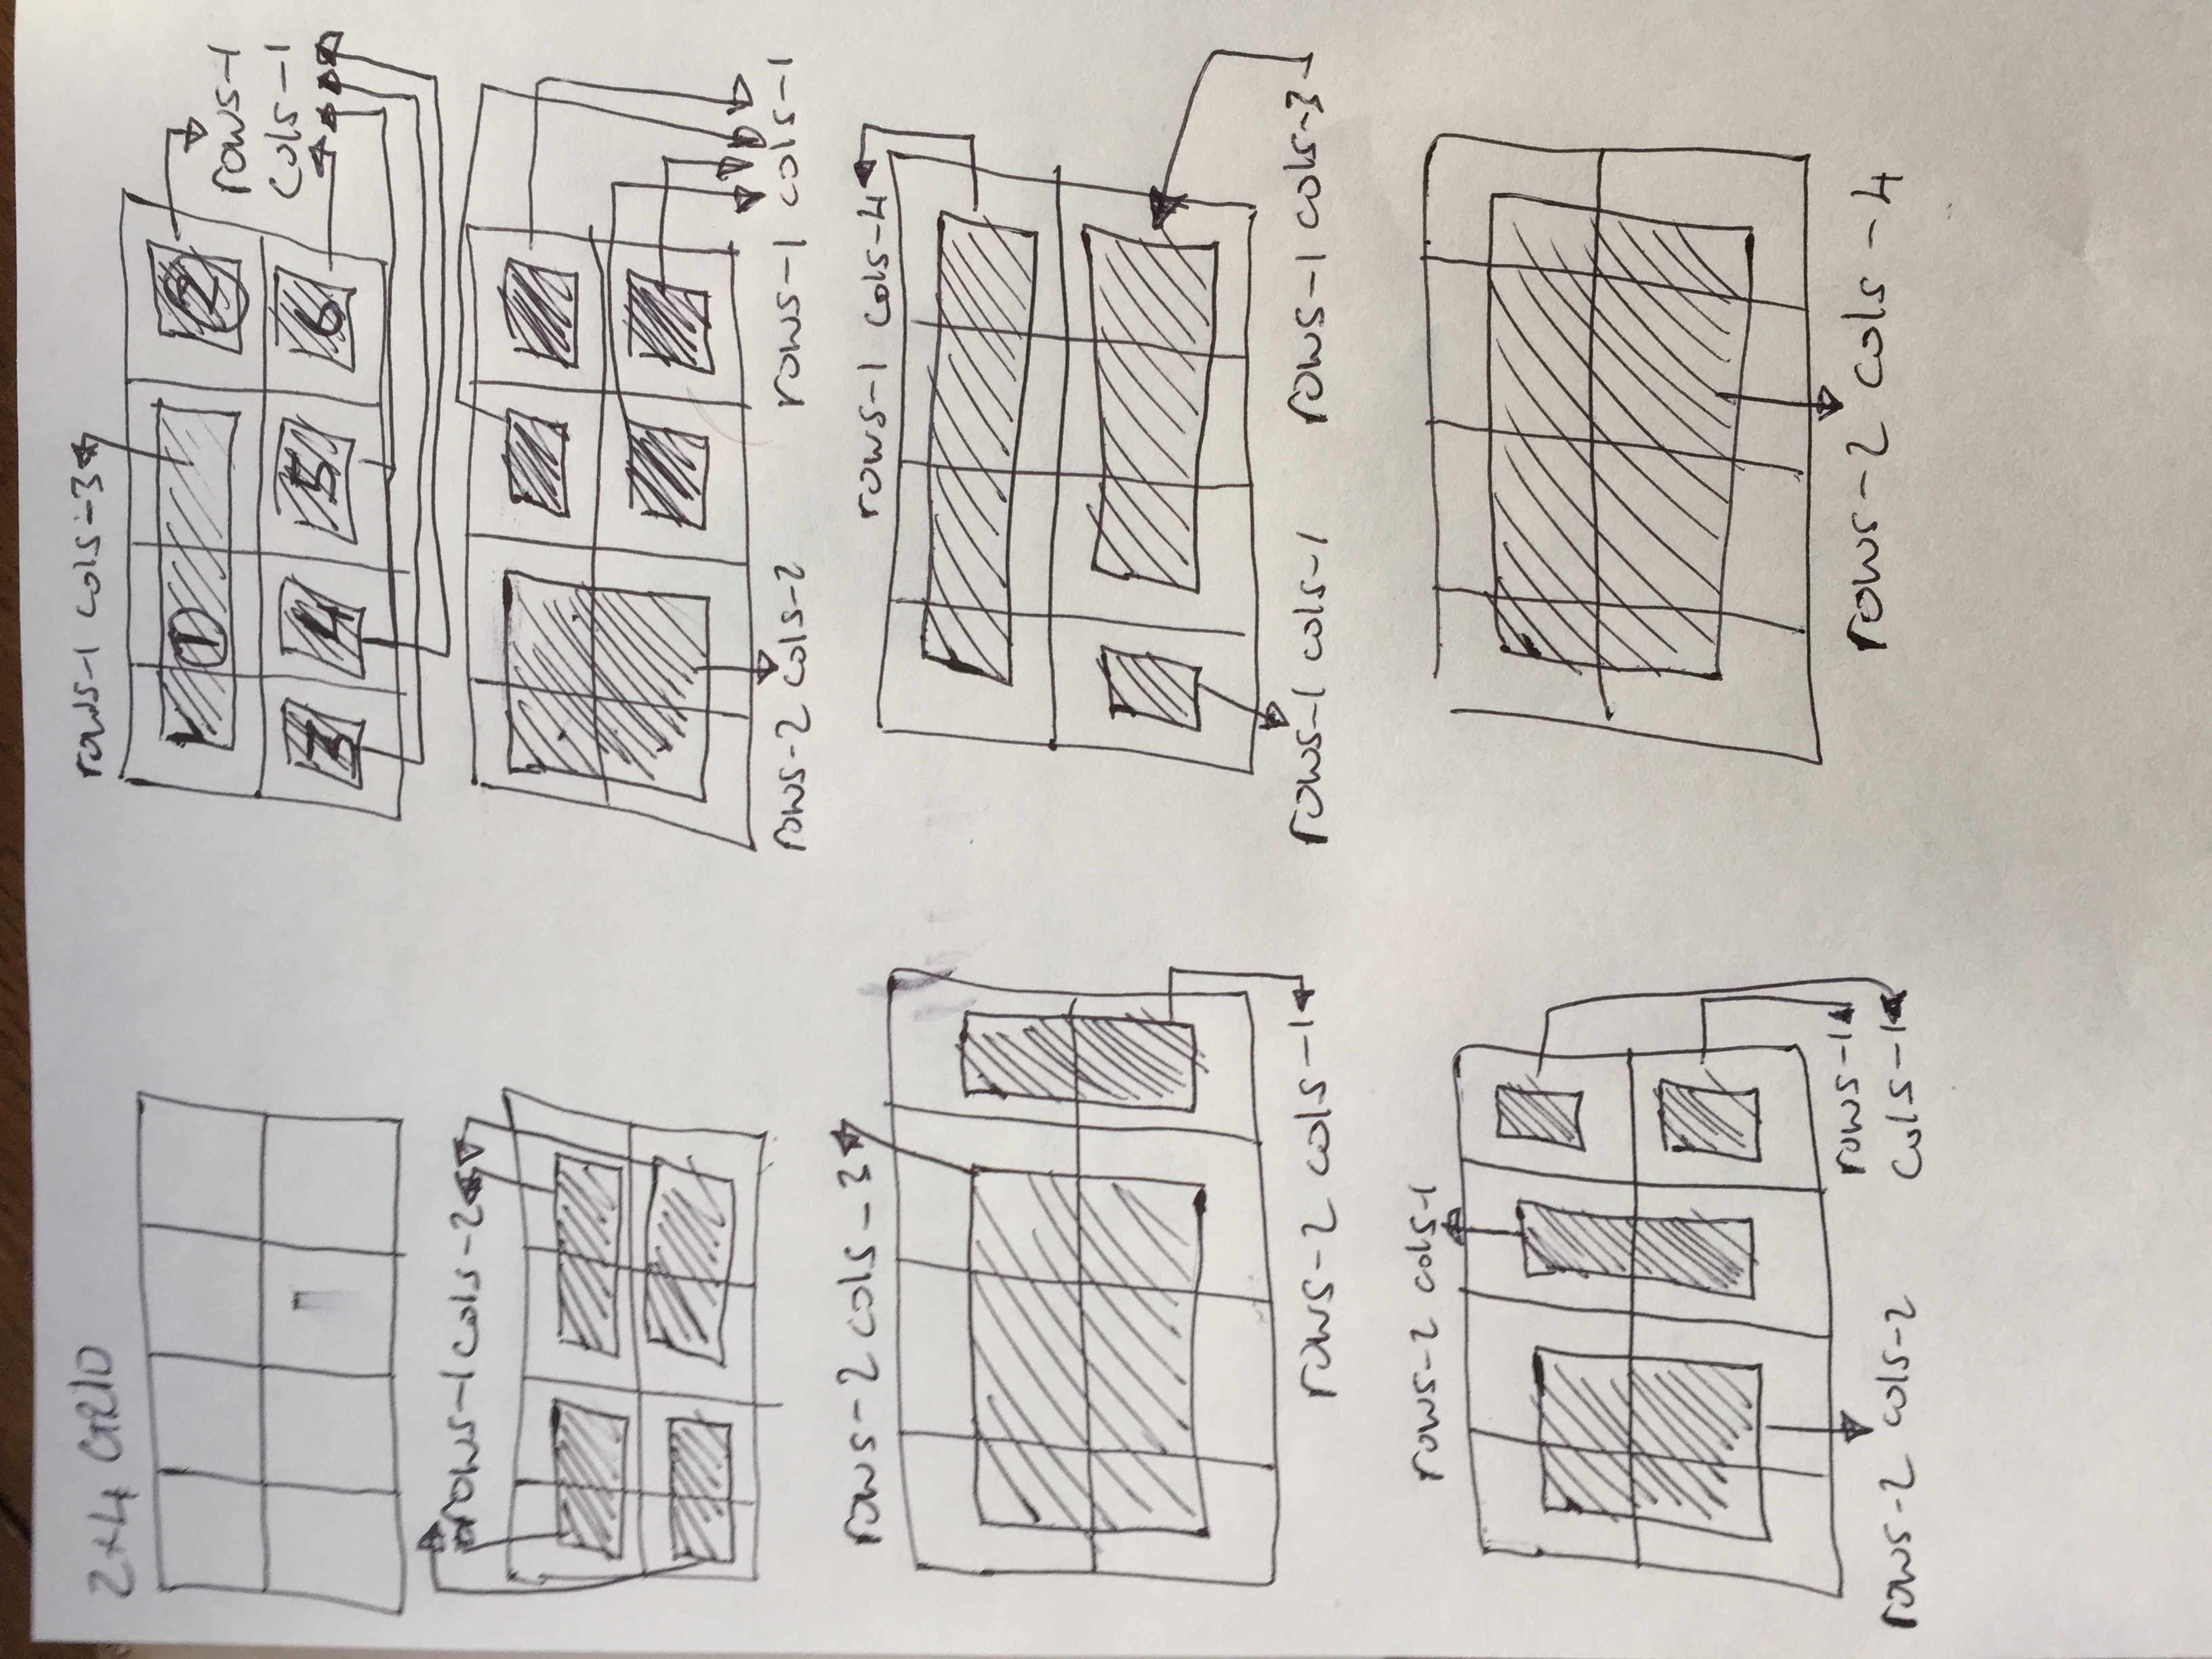
2. what do i enter into the classes box to create the grid. for example if I want a 4x4 grid. or a 2x1/2x2? your excel shows that I should use .rows and .cols. but what exactly do I enter into the classes box.

my guess would be for a 4x4: " .rows-1 .cols-1 .rows-1 .cols-1 .rows-1 .cols-1 .rows-1 .cols-1 .rows-1 .cols-1.rows-1 .cols-1.rows-1 .cols-1.rows-1 .cols-1" but this seems very strange. please give an example that can be copy-pasted.

3. how do I assign a graphic to a box in this grid. do I assign the top and left to the coordinates of a box? so in a 4x4 the top left box would be top:0 left:0 and the second box would be top:0 left:25. do I need to do anything else?

4. is there any limitation to the size of the graphics?

as you can see, your explanation seems very straight forward, but in practice there are still some valid questions. maybe this feedback could be usefull for creating the documentation. I will keep trying, hopefully I will be able to answer the questions. What I could really use is some step by step instructions. I think I understand the concept. I am just unable to translate this into what to do in the builder.


Picture of Matt Leathes
Re: Hotgraphic
by Matt Leathes - Monday, 13 July 2015, 4:36 PM
 

Hi Sander

We've got a big push in v2 to update the documentation to make it more detailed and useful. I will make sure what Mark and Brian have added here gets included.

Picture of sander van zijl
Re: Hotgraphic
by sander van zijl - Tuesday, 14 July 2015, 2:06 PM
 

that would be very useful. but as I said above: the manual should not only explain the concept but should be more for us dummies who can not translate that into what to do exactly. there are lots of easy things that are apparent for the developers but not for the non-developers. for example: how to use a classes box. And where we can find what can go into a classes box.

Picture of Brian Quinn
Re: Hotgraphic
by Brian Quinn - Tuesday, 14 July 2015, 4:05 PM
 

Hi Sander,

We actually intend to provide a more user friendly UI for more complicated components in a future version of the authoring tool.  The Hot graphic component is one of those.

I've attached a screenshot of how it looks in action.

Regards,

Brian


Mark
Re: Hotgraphic
by Mark Lynch - Tuesday, 14 July 2015, 4:24 PM
 

Hi,


Two further Screen shots of how to do that in the AT.


All of the classes are set to rows-1 cols-2

Mark
Re: Hotgraphic
by Mark Lynch - Tuesday, 14 July 2015, 7:09 PM
 

Here are some worked examples of using the classes on the 4x2 Grid.

Start with a blank grid and when you place your images onto that grid count the rows and cols that the image spans. Think of spanning as covering.

My images are the shaded regions. Apologies in advance for the poor handwriting.

Maybe some kind photoshop wizard could digitise my hand sketches as a nice graphic?

The other thing that adds to the complexity is that you still have to set the top and left pin positions.

This is a tough concept to grasp so keep asking questions if it's still not clear.


Picture of sander van zijl
Re: Hotgraphic
by sander van zijl - Wednesday, 15 July 2015, 7:50 AM
 

Thanks again,

I thought that everything was clear now. However nothing is showing up.

So I put my settings and stuff in a pdf document. I have made print screens of all the settings, the result and the generated html code. Everything seems to be okay, but I do not see the hotgraphic component with the boxes. There is something on the page, because I can find a link to a popup, but the table does not seem to be rendering. So I am wondering if I still have problems with:

1. Image sizes?
2. size of invisible background image?
3. a combination of 1 and 2
4. a setup problem with the builder (do I need a newer version)
5. maybe I am using an older component? we have updated everything to the latest versions

could you take a look at the pdf and try to see if something is wrong?

Mark
Re: Hotgraphic
by Mark Lynch - Wednesday, 15 July 2015, 9:19 AM
 

Hi Sander,

All that looks good to me. I think it's missing some base styling which is included in this PR

https://github.com/adaptlearning/adapt-contrib-hotgraphic/pull/96

Which leaves the hotgraphic @ version 1.1.7

Picture of sander van zijl
Re: Hotgraphic
by sander van zijl - Wednesday, 15 July 2015, 10:13 AM
 

okay, so I have updated the hot graphic component, but still nothing is showing.

removing the component and adding it again does not work.

I have attached the published course. If someone would be able to explain why this is not working as it should, I would be very grateful

Picture of Brian Quinn
Re: Hotgraphic
by Brian Quinn - Wednesday, 15 July 2015, 10:48 AM
 

Hi Sander,

I took the course folder from your test-course.zip file.  Note that you had _useGraphicsAsPins set to false in this.  I set it to true and removed the reference to the television image.

I couldn't be sure you're on the latest version of the code so I did the following.

  1. Cloned the adapt_framework into a new folder.
  2. Ran adapt install.
  3. Copied the amended course folder into src/course.
  4. Ran grunt build.

You can see the output of the course attached but its working as expected now.  I'd suspect a combination of the course being built with an old version of the hotgraphic component and the _useGraphicsAsPins being set to false caused this.  

Regards,

Brian


Picture of sander van zijl
Re: Hotgraphic
by sander van zijl - Wednesday, 15 July 2015, 11:33 AM
 

the set to false flag was only in this build. I have tested with both on and off. sorry for that.

but I do not have access to grunt build and stuff like that. I need to solve this with the authoring tool only.

maybe I should rebuild the entire course. (so delete it and start over) will try that now.

Picture of Brian Quinn
Re: Hotgraphic
by Brian Quinn - Wednesday, 15 July 2015, 12:47 PM
 

How are you running the authoring tool?

Also, did you manually upgrade the hotgraphic component as Mark suggested?

Verify that it's the latest version (1.1.7).  You can get this by Plugin Management > Components as shown on the screenshot below.

Also try re-selecting the Vanilla theme in your course and clicking Publish/Preview again.  This will do a full re-build.

Regards,

Brian

Picture of sander van zijl
Re: Hotgraphic
by sander van zijl - Wednesday, 15 July 2015, 2:53 PM
 

Well, we can only update by pressing the update button in the tool. Since we do not have access to the server that is running the tool. We are running the tool on a webserver, zo every teammember can access it and work on a part of the project. (using the same username off course). We do this on purpose, because we want to use the builder, not the framework. 

after updating I deleted the course and started on a new one, and guess what: I have images.

They are cut in half however. So I only see the top part of the images. The images are 600x600. I would expect that they would be sized correctly automatically.  They are displayed correct if I change the grid to rows-1 cols--1. Resizing them to the correct size is not that difficult. (Now if only I could delete the images from the asset database. :-) )

So in short to make this work:

  • You need to use hot graphic component version 1.1.7
  • After the update you will need to force a rebuild by applying the theme again.
  • The "Use as graphics pins" should be "false"
  • In the item add dialogue the second classes box in the dialogue should indicate the size in the 4x2 grid. so rows-1 cols-2 means the size of the box is 1 row, and 2 columns.
  • The top and left properties of each item determines the location of the graphics. 0,0 is the upper left box. 50,0 is the lower left box. if you use a 4x2 grid than 50,25 is the bottom row, second box.
  • The image size aspect ratio should fit the box. so rows-1 cols-1 can handle square images. rows-1 cols-2 a rectangular image. (or not if you want to have the cut off effect)

anything I forgot?

thanks for all the help.

Picture of Brian Quinn
Re: Hotgraphic
by Brian Quinn - Wednesday, 15 July 2015, 2:59 PM
 

No problem.  One minor thing:

Use graphics as pins should actually be  set to 'true' if you want the tile effect. ;)

Picture of sander van zijl
Re: Hotgraphic
by sander van zijl - Wednesday, 15 July 2015, 6:02 PM
 

Yes "true".


useGraphicsAsPins

When this is set to true, the item graphics can be used as 'pins'. When this is set to 'false' (per default), a main poster image is displayed, with pins overlayed to trigger the hot spots.

Picture of Matt Leathes
Re: Hotgraphic
by Matt Leathes - Tuesday, 14 July 2015, 4:44 PM
 

Totally get what you mean. We're in the process of adding a new set of documentation that is aimed at non-developers, specifically targeting people working with the authoring tool.